
Valve Sense: mobile acoustic emission testing for valve leaks
One sensor. One smartphone. AI-supported leak detection and quantification
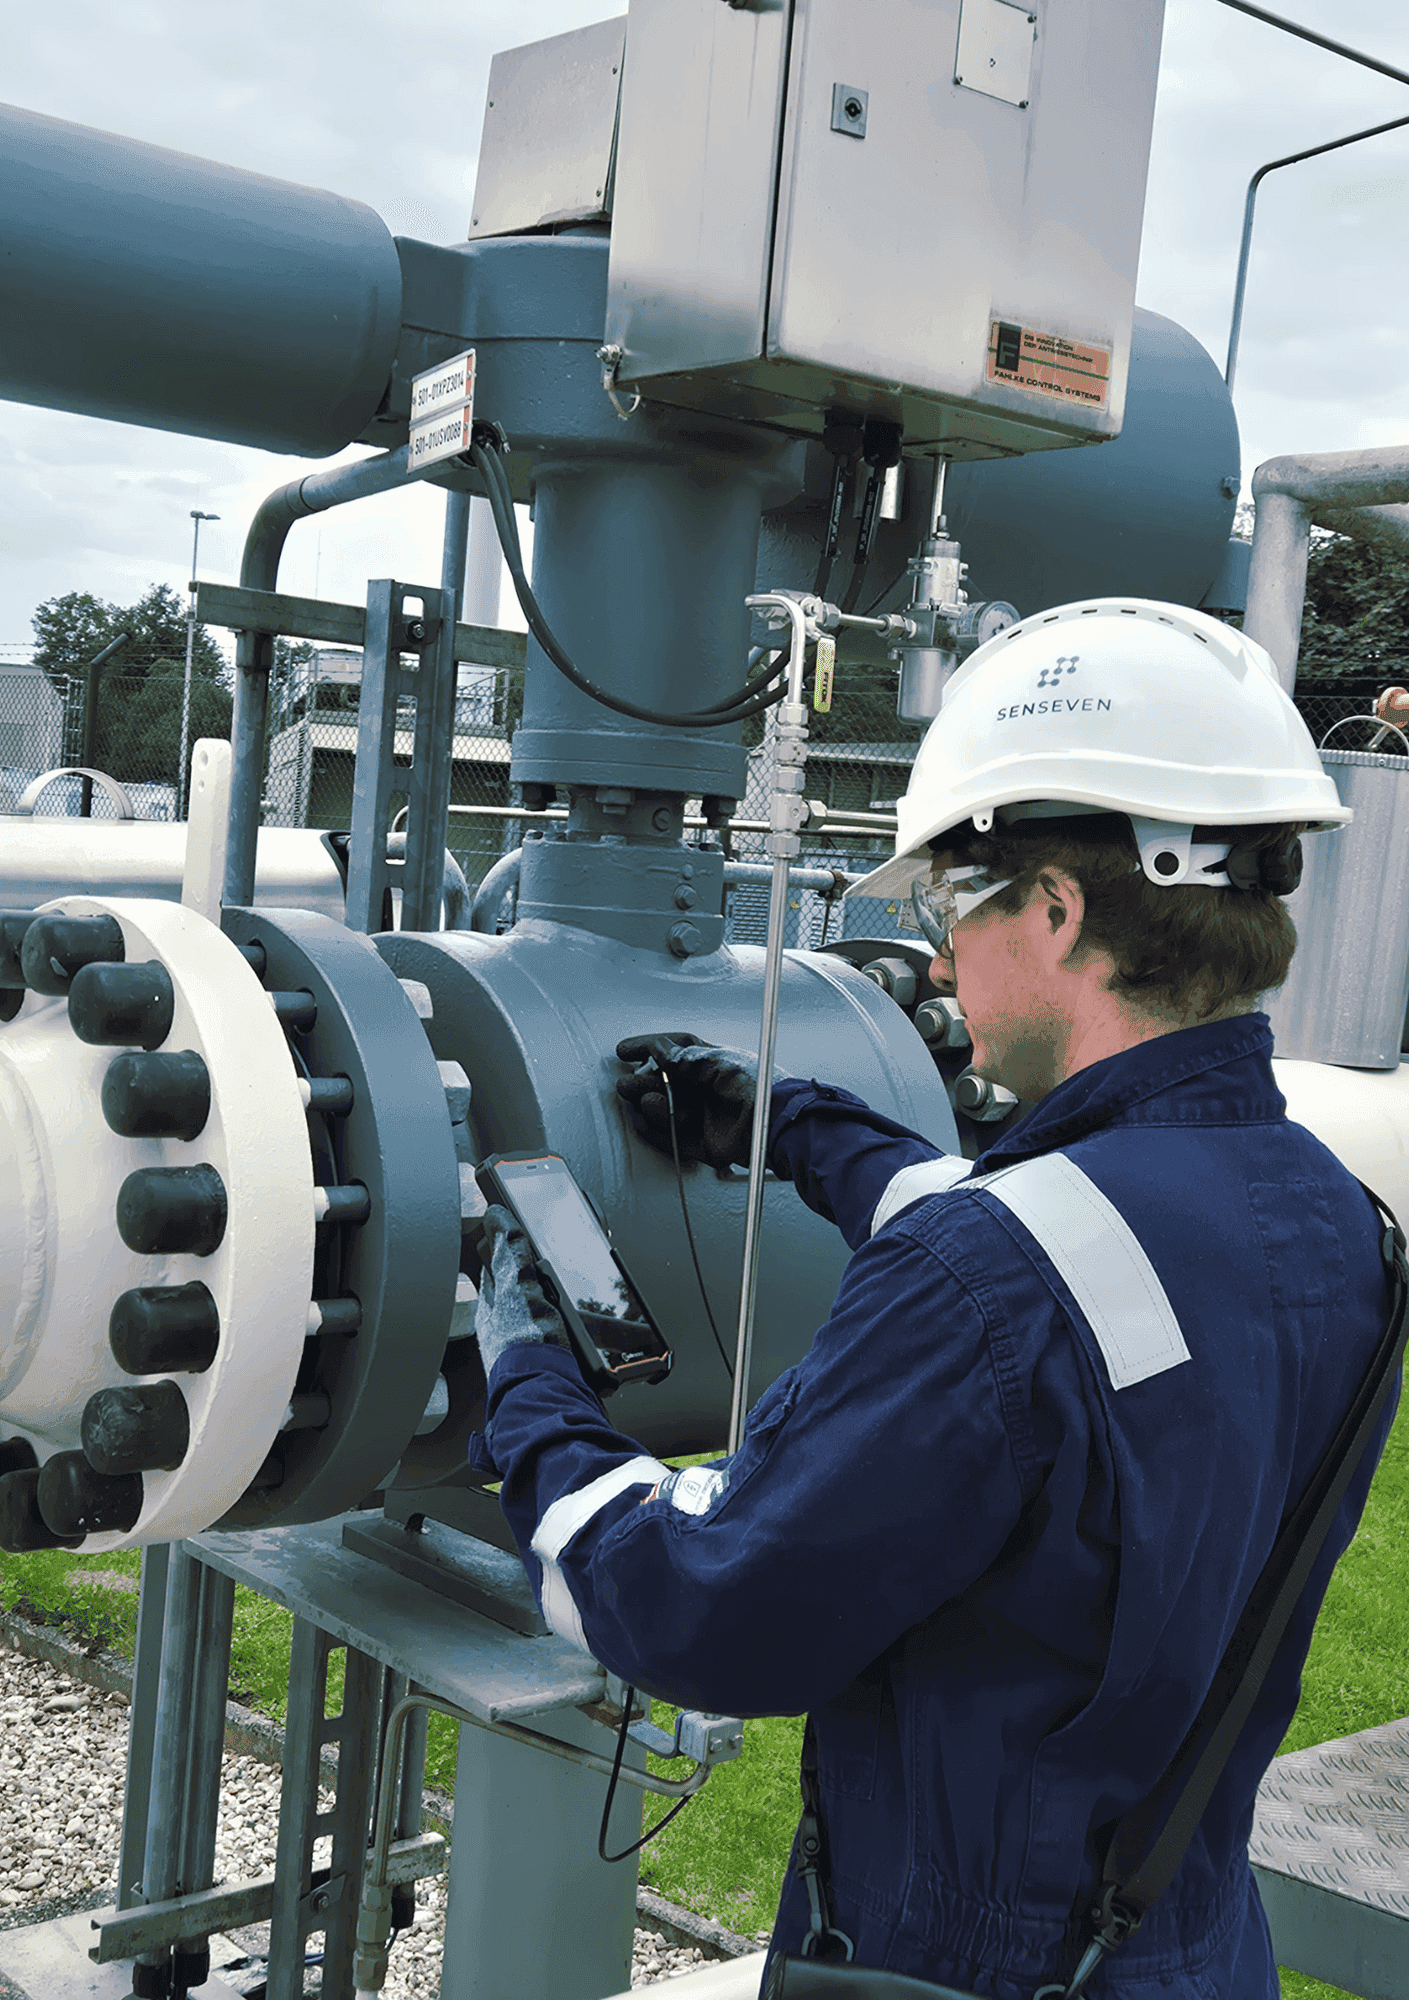
Built for real plants. Proven in the field.
- 20,000
- valves inspected by our customers
- 2 min
- to inspect a valve
- 1 min
- to generate an inspection report
- 1
- software-guided workflow
How Valve Sense detects leaks in valves - the technology
Acoustic emission testing (AET) captures the high-frequency stress waves generated when pressurized fluid passes through a leaking valve seat. These signals - invisible to the human ear - are picked up by a sensor placed on the valve body during normal plant operation.
Senseven's AI algorithms analyze the signal in real time: detecting whether a valve leaks, and estimating the size of the leak.
No production shutdown. No dismantling. Software-guided workflow for trained operators.
The whole inspection of a valve takes approximately 2 minutes and the inspection result appears on-screen within seconds.
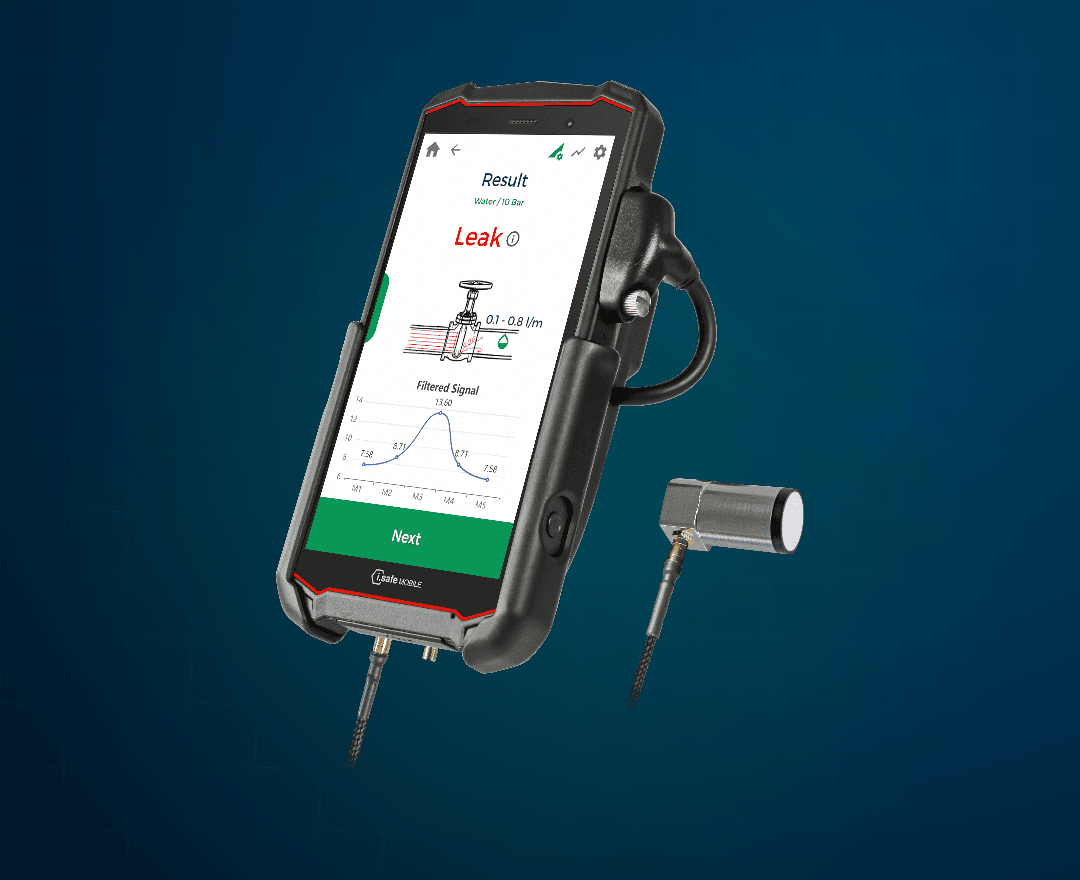
Valve Sense for Ex Zone 1/21
Acoustic emission system for industrial valve inspection in explosive atmospheres. Paired with the IS540.1 intrinsically safe smartphone from i.safe MOBILE. Ideal for: Oil & Gas, petrochemical and chemical processing. 2 min per valve · Ex Zone 1/21 · Guided workflow · ATEX Zone 1/21 · IECEx · IS540.1
Discover Valve Sense Ex→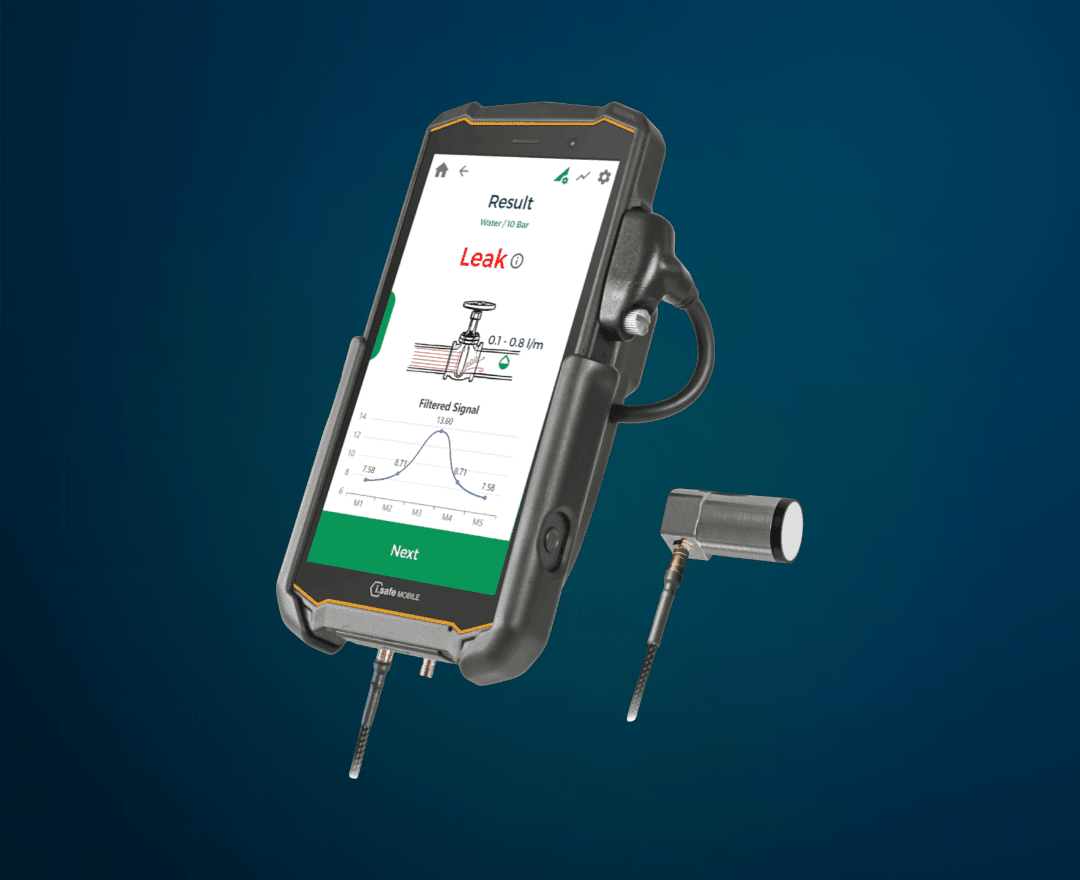
Valve Sense for Non-Ex Areas
The same powerful acoustic emission technology for standard industrial environments. Paired with the IS540.RG from i.safe MOBILE — ready to use in minutes. Ideal for: Power generation, food & beverage, pharma, pulp and paper. 2 min per valve · Standard industry · Guided workflow · Industrial Non-Ex · IS540.RG
Discover Valve Sense Non-Ex→Valve Sense supports you in identifying through-valve leakage and defects in steam traps before it can cause any severe damage to your assets.
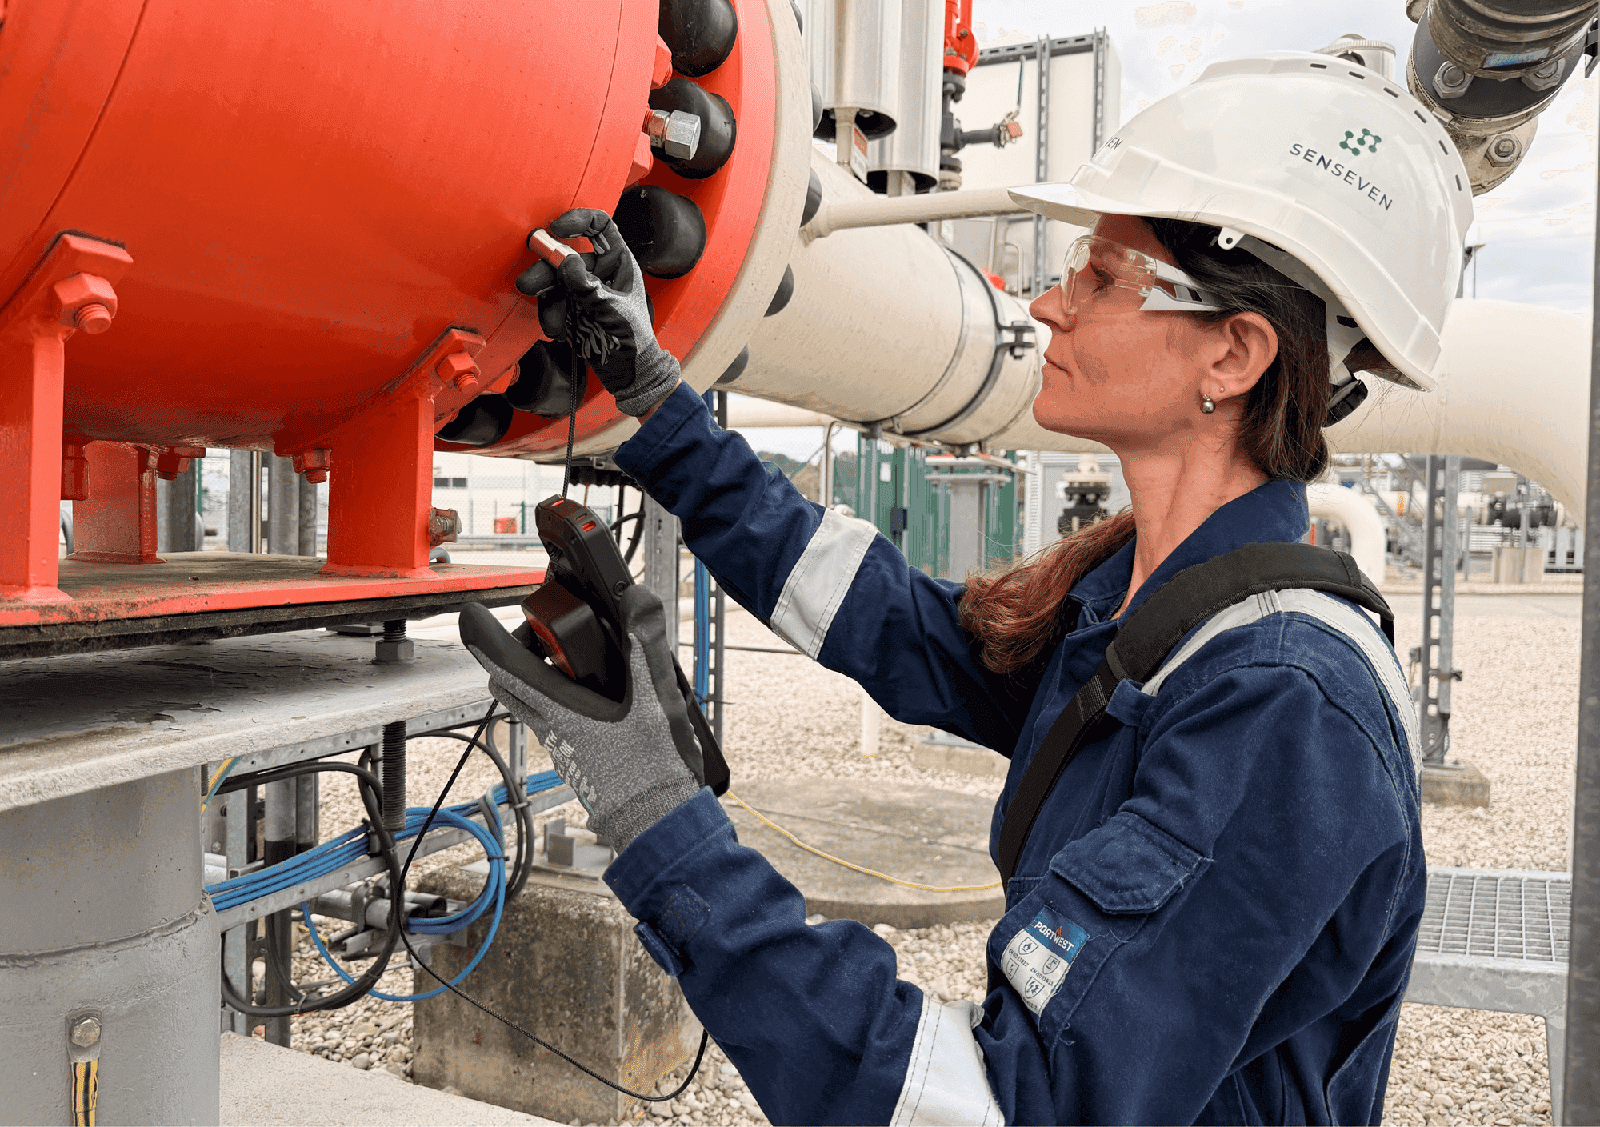
Four steps. Two minutes. Inspection complete.
Identify the valve
Scan the NFC tag on the valve or enter the valve ID manually. All metadata is stored automatically. No paperwork, no duplicate entries.
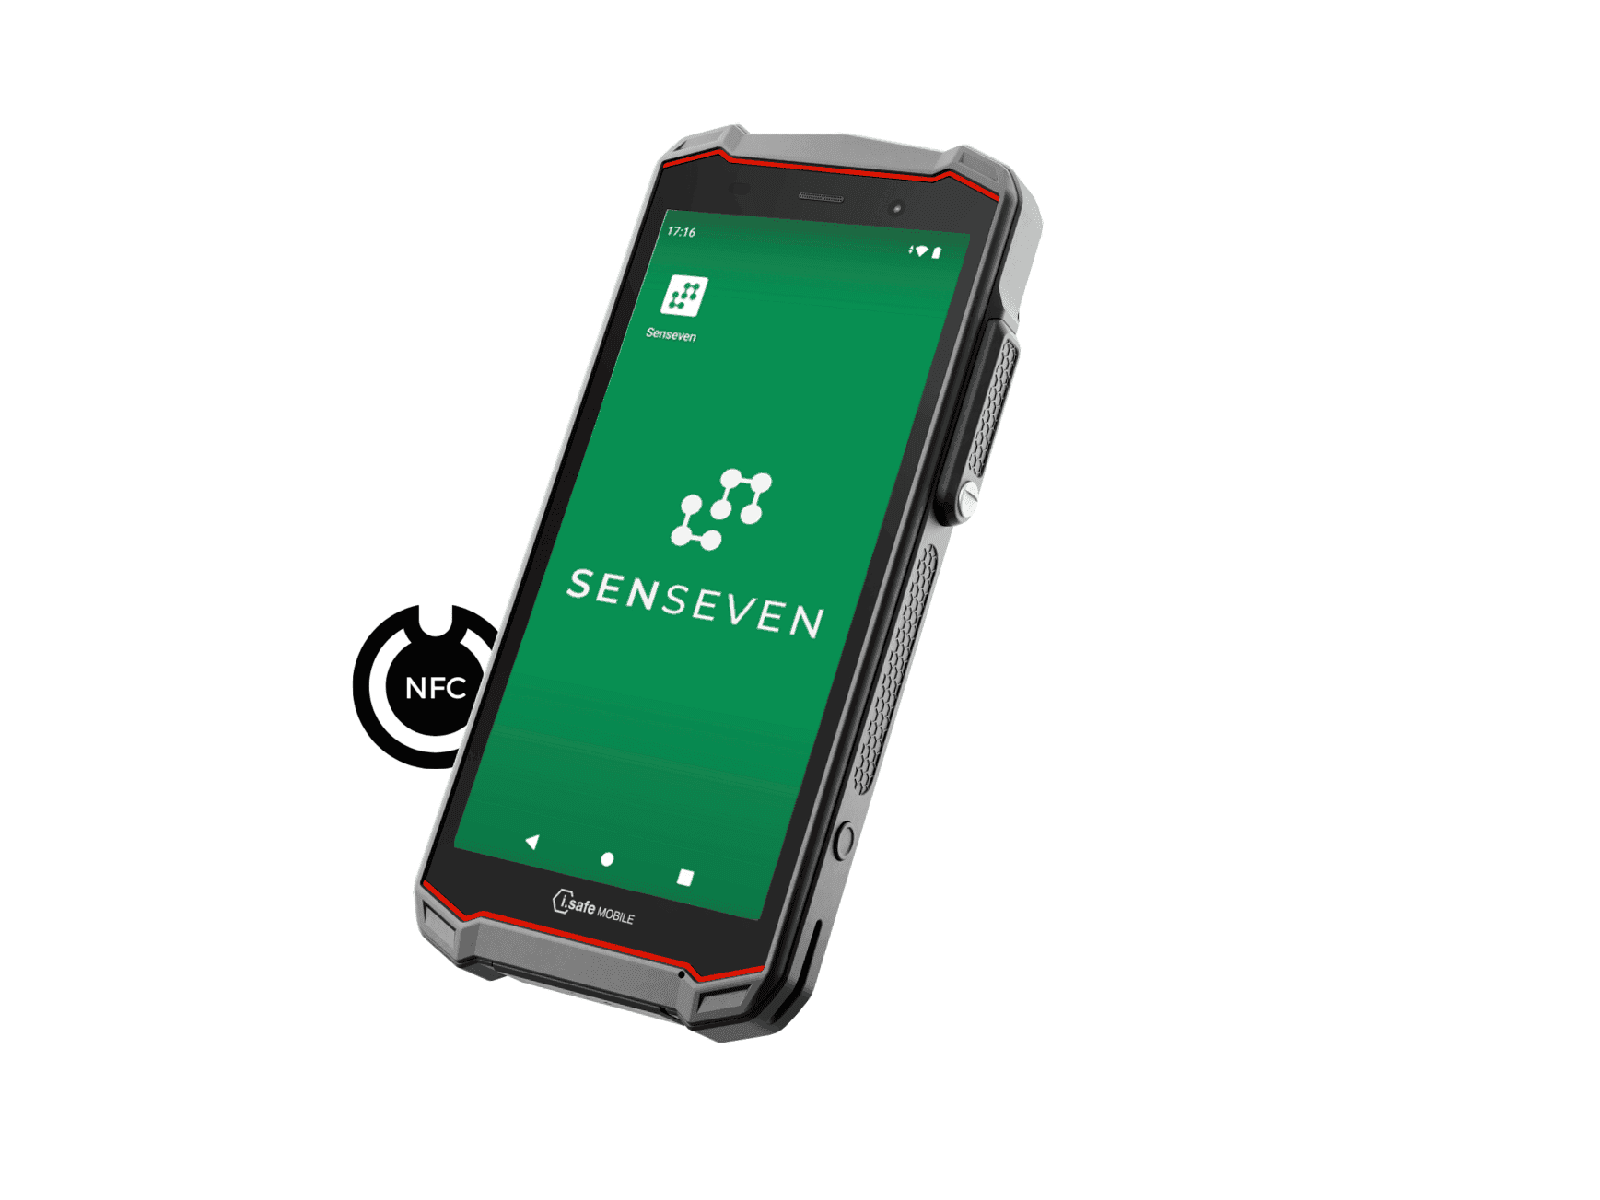
Collect the acoustic emission signals
The app guides you step by step to the correct measurement points on the valve. The sensor is placed directly on the valve body. No disassembly, no process interruption.
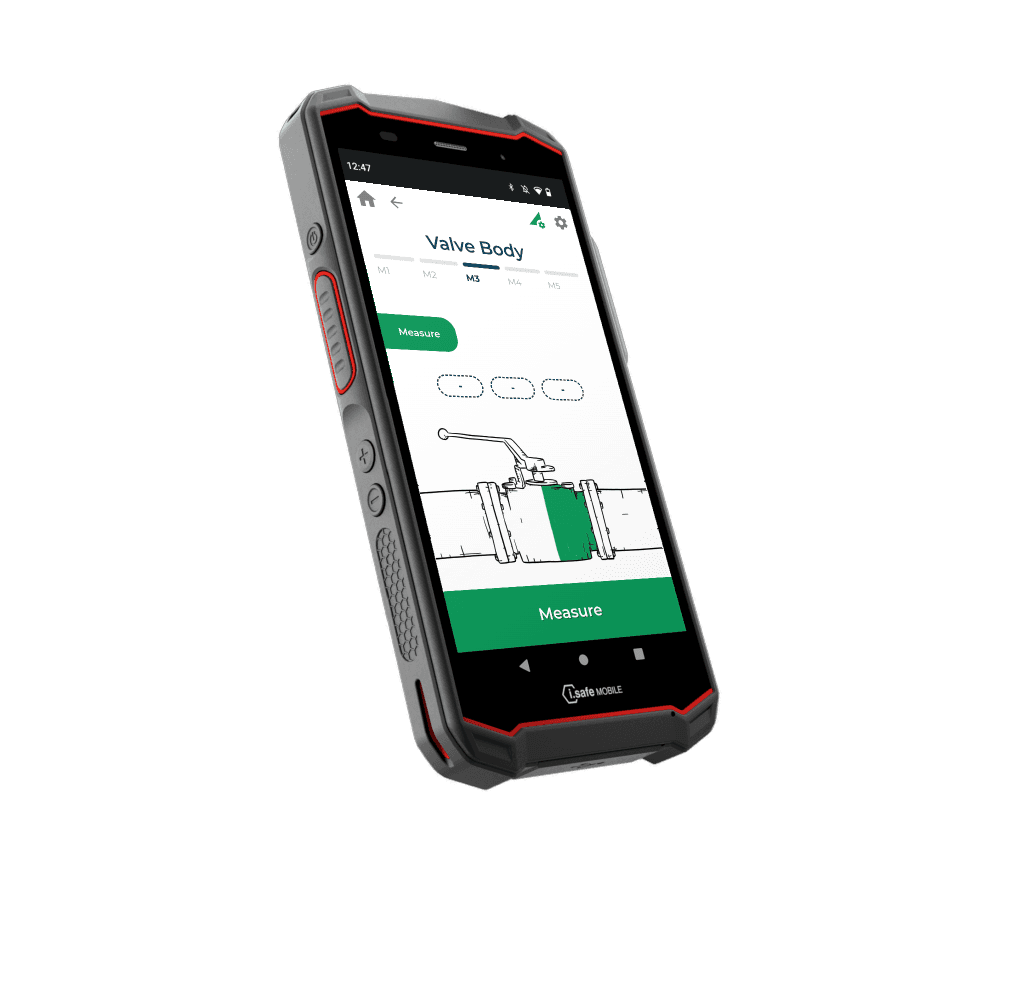
Get your results instantly on site
The AI model analyzes the signal and displays the result directly on the smartphone: leaking or tight, including an estimated leak rate. The result is immediately available for trained operators.
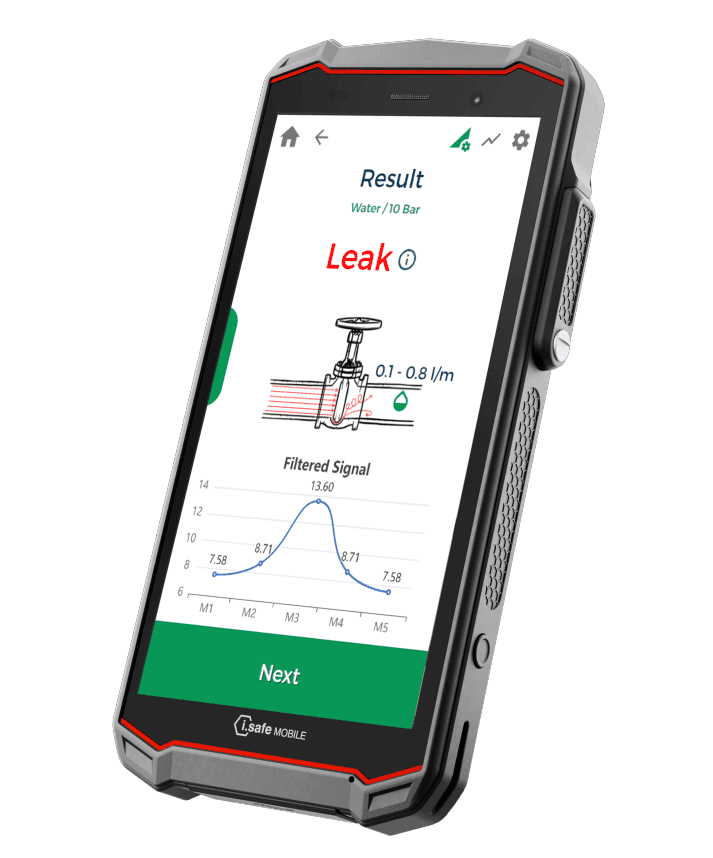
Automated report ready to share
Every inspection is automatically documented and synced to the Senseven Backoffice. ISO-compliant PDF reports are generated with one click – ready for your maintenance team or audit documentation.
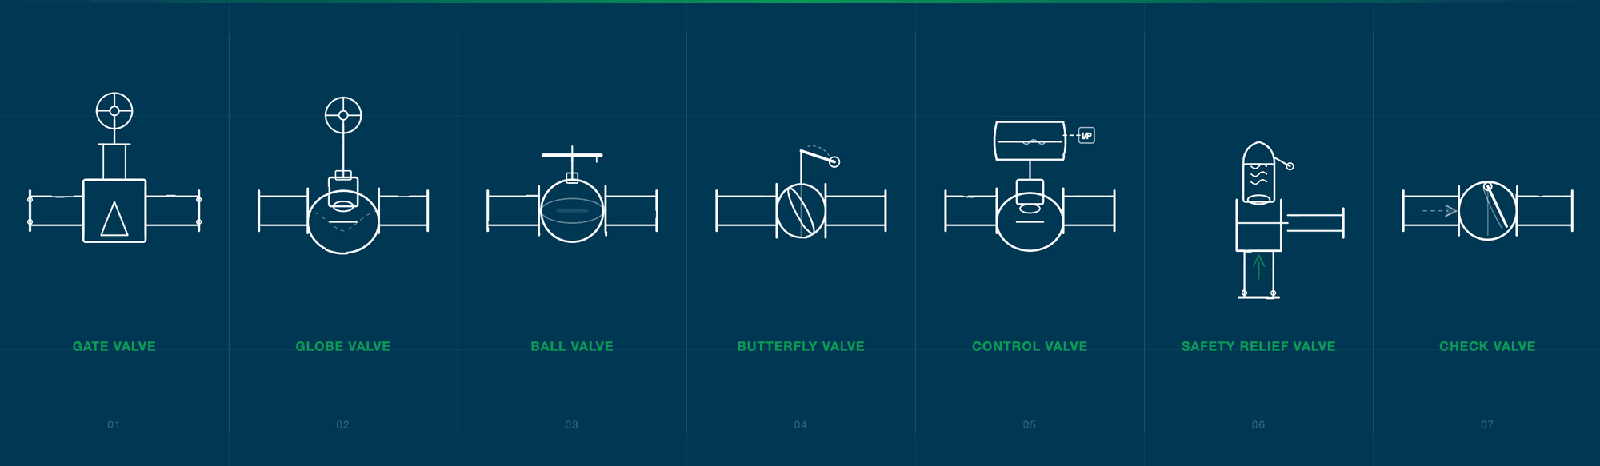
Supported valve types and industries
Valve Sense works with all kinds of valves across all sizes.
Common applications include:
- Valve Types: Gate valves · Globe valves · Ball valves · Butterfly valves · Control valves · Safety relief valves (SRV/PSV) · Check valves
- Industries: Valve Sense is deployed across oil & gas, petrochemical, chemical processing, power generation, food & beverage, pulp and paper and pharmaceutical plants. Anywhere pressurized valve systems require regular inspection.
See Valve Sense in action
Click through a real inspection process in the Valve Sense App – no download, no commitment.
How does Valve Sense compare to other methods?
Valve Sense replaces specialist-dependent, time-intensive inspection with an AI-guided process trained operators can run in a short, repeatable workflow.
| Valve Sense | Other systems | Manual inspection | |
|---|---|---|---|
| Expertise required | Trained operator – AI-guided | Specialist / NDT certification | Specialist |
| Inspection time | ~2 minutes | Variable | Labour-intensive |
| Leak quantification | AI-estimated, on-site | Formula-based, manual calculation | No |
| No production shutdown | Yes | Yes | Depends on method |
| ATEX Zone 1/21 | Yes (Ex version) | Device-dependent | No |
| Automated reporting | Yes – PDF, ISO-compliant | No | No |
| Operator training | 1 hour online | Weeks + certification | Weeks |
Watch: A complete inspection in the field
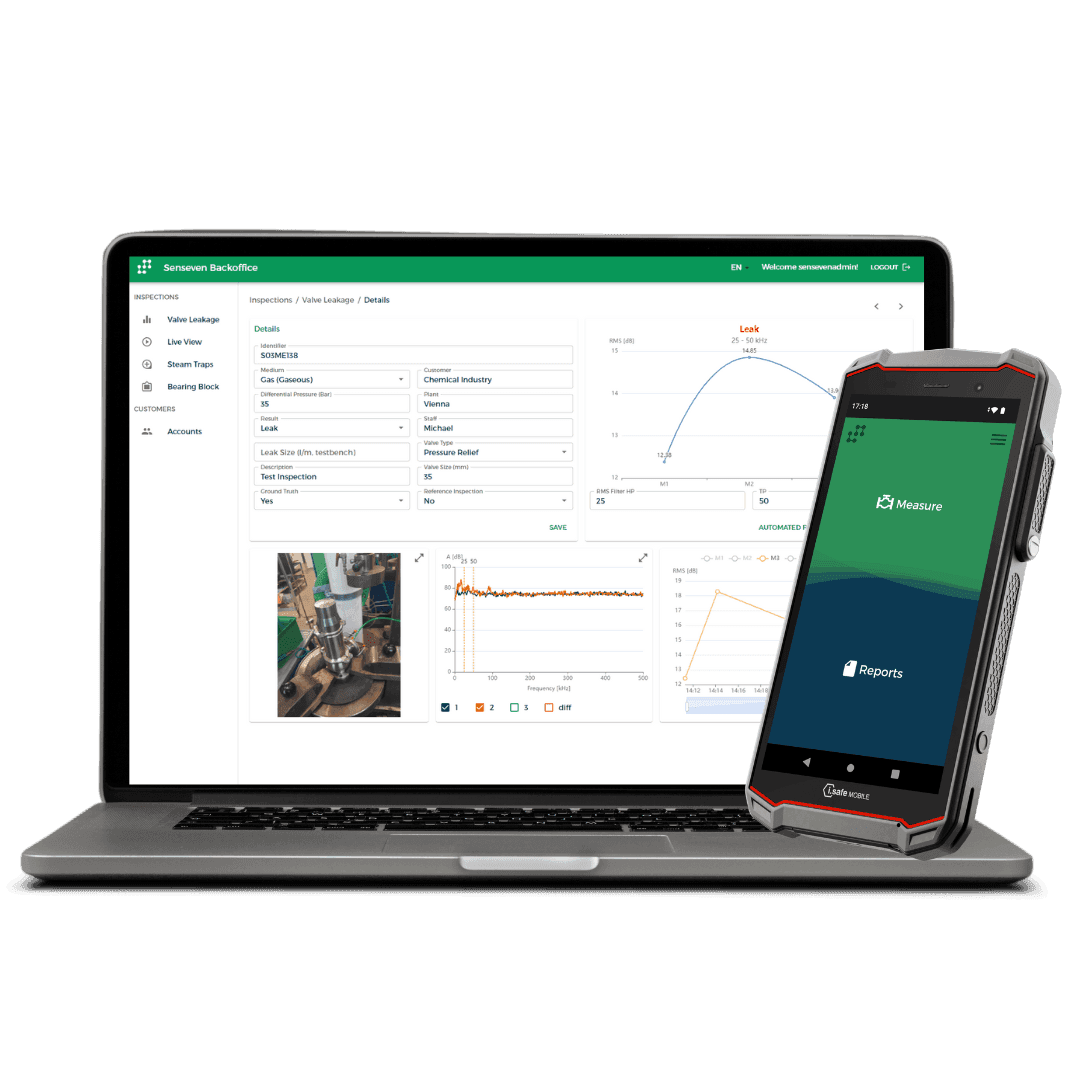
After the inspection: Senseven Backoffice
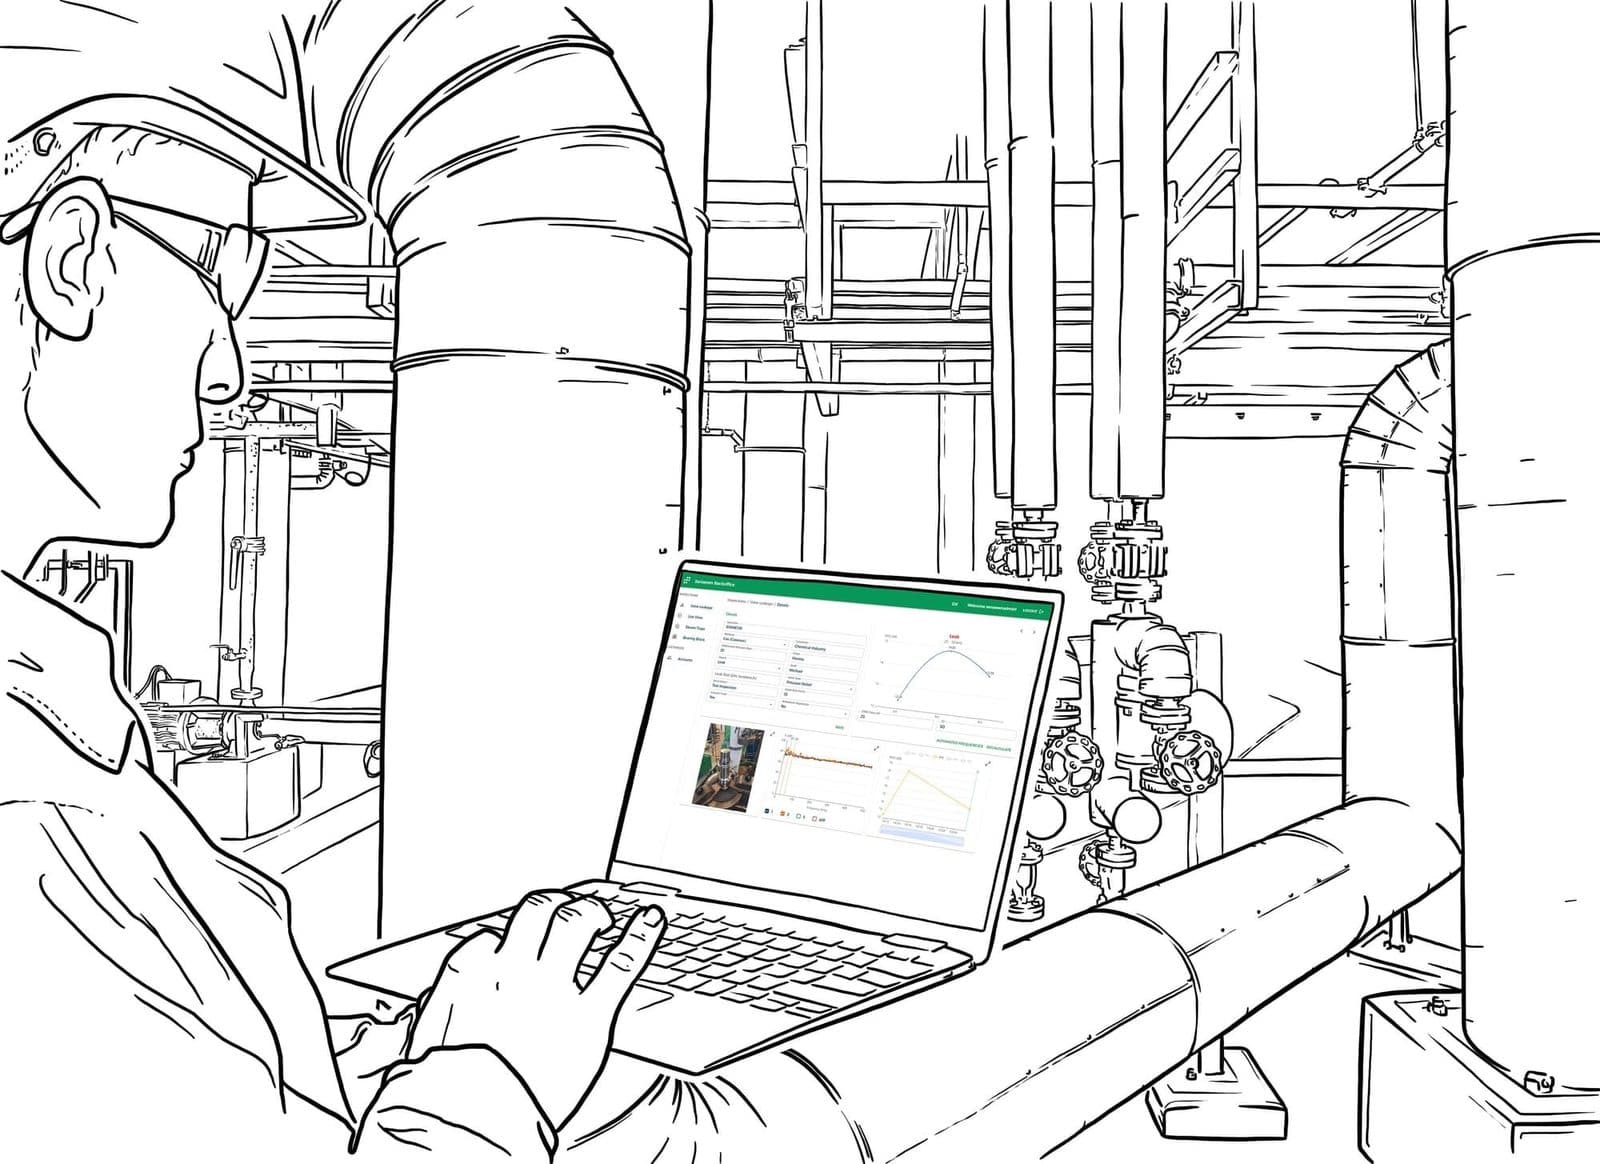
Every measurement is automatically synced to the Senseven Backoffice. It is your central hub for managing, analyzing, and acting on inspection data across your entire plant.
Senseven Backoffice
The three core functions turn field measurements into a shared, prioritized maintenance workflow. Platform basics stay separate, so the primary work is immediately clear.
Filter, sort and analyze
Access all inspections from any browser. Filter by valve status, location, or date and build maintenance priorities based on real leak data.
Standardized PDF reporting
Generate ISO-compliant inspection reports with one click. Customizable templates for internal documentation or client handover.
Automated synchronisation
No internet connection needed during inspection. All data is automatically transferred to the cloud as soon as a connection is available.
Built into every Backoffice workspace
Access
Any browser
Languages
Multi language
Data
Unlimited storage
For advanced users: Senseven Expert Suite
Need to go beyond the standard inspection? The Expert Suite gives experienced operators direct access to raw signal data for advanced diagnostics.
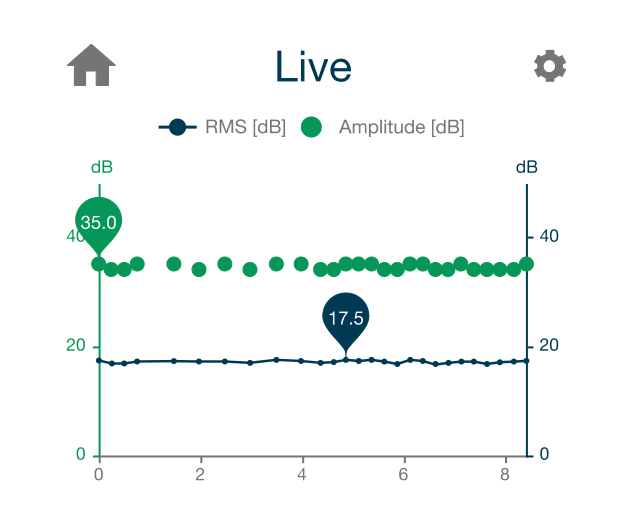
Live view
Follow amplitude and RMS values in real time during measurement.
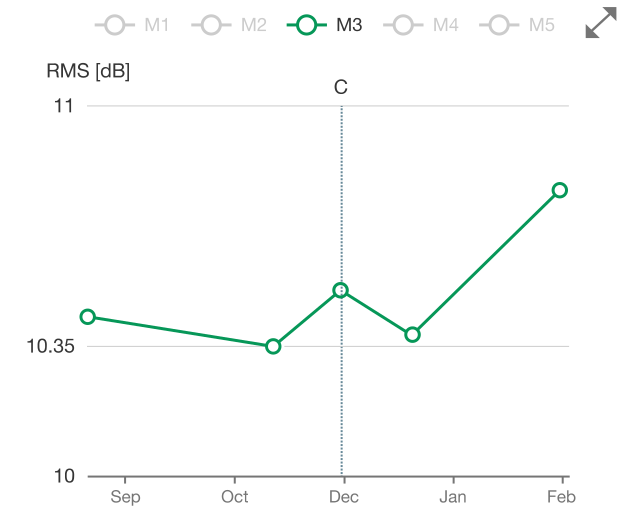
Trend over time
Compare measurements across inspection cycles and detect deviations early.
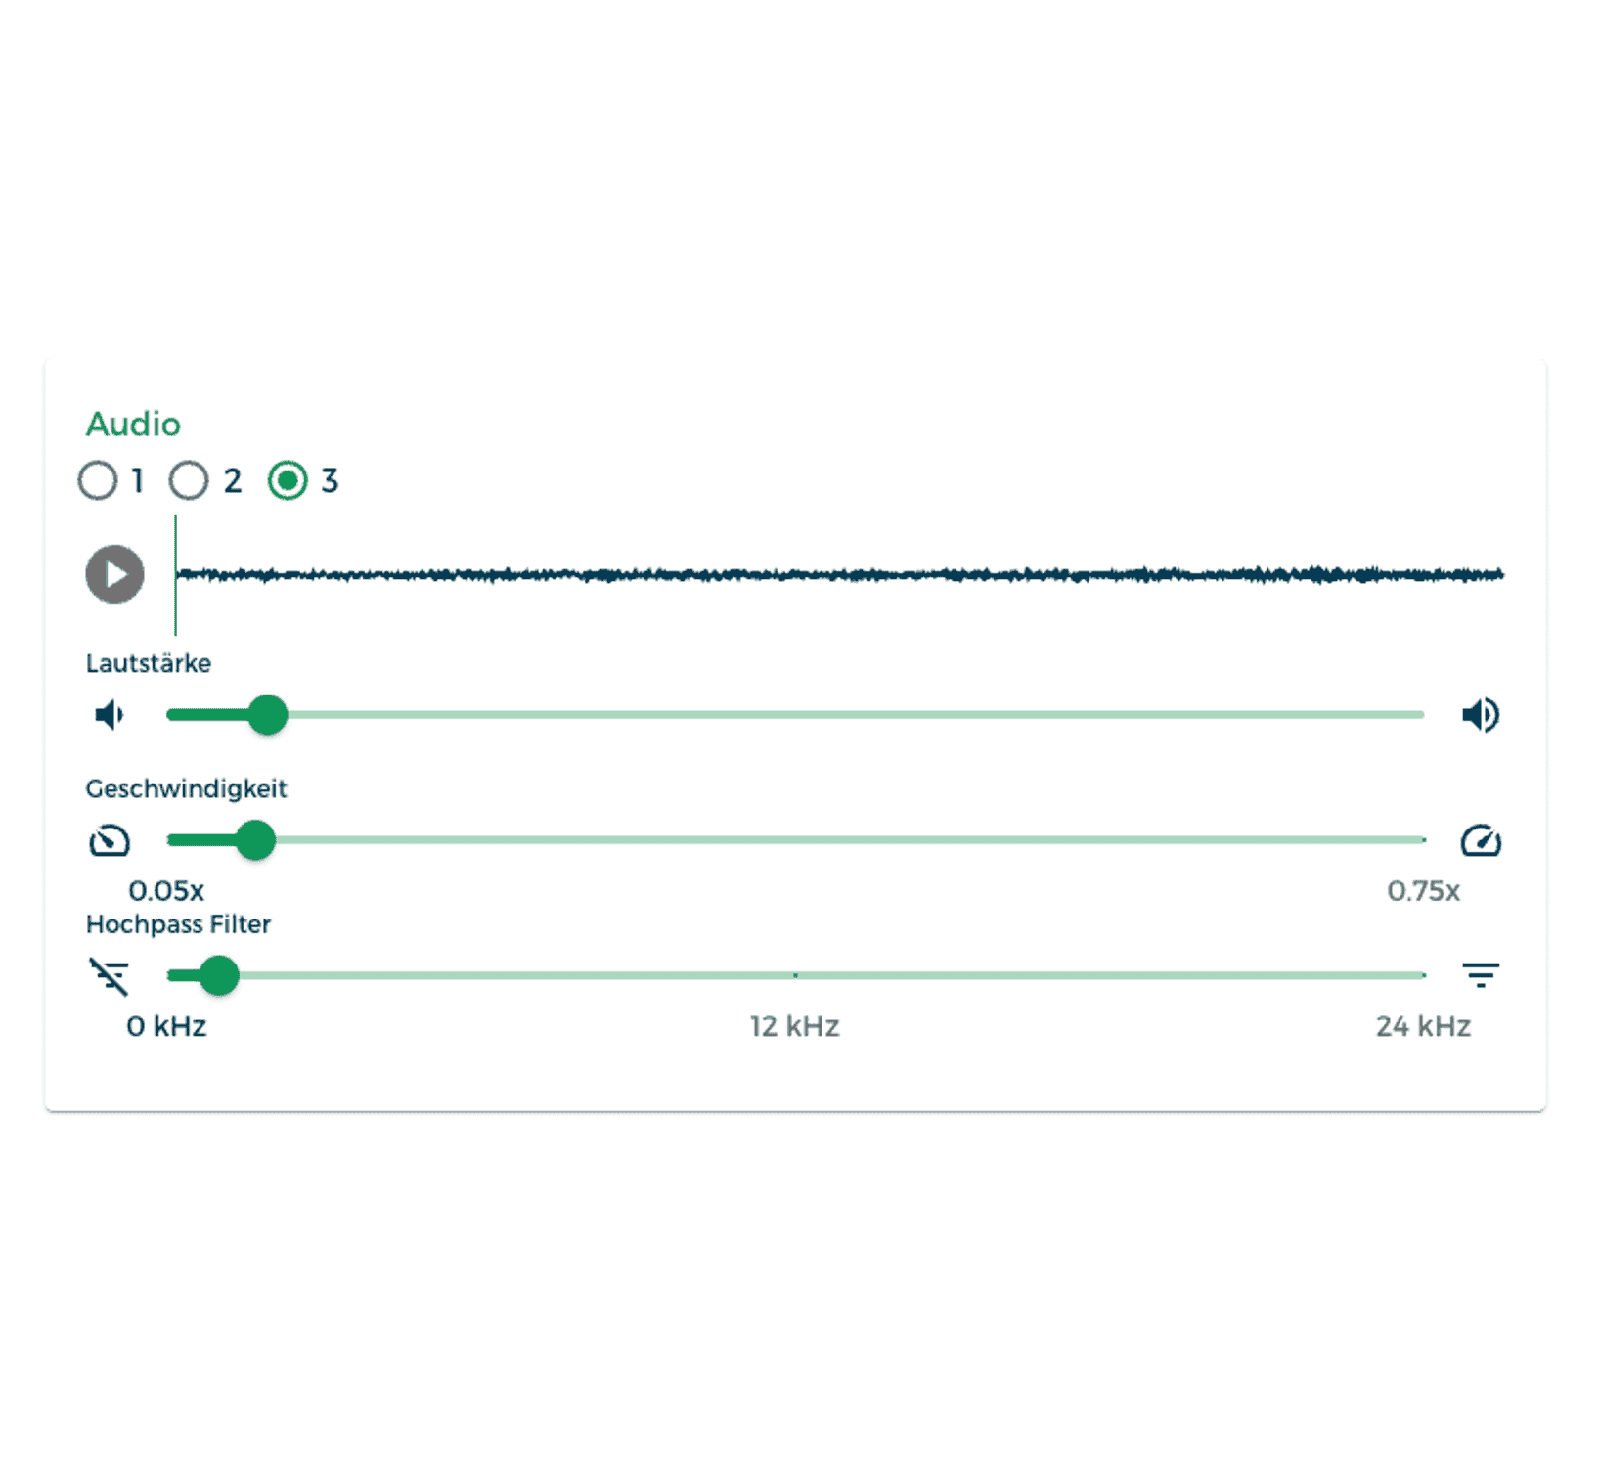
Live Audio
Hear the acoustic emission signal converted to audible frequency range: for expert intuition.
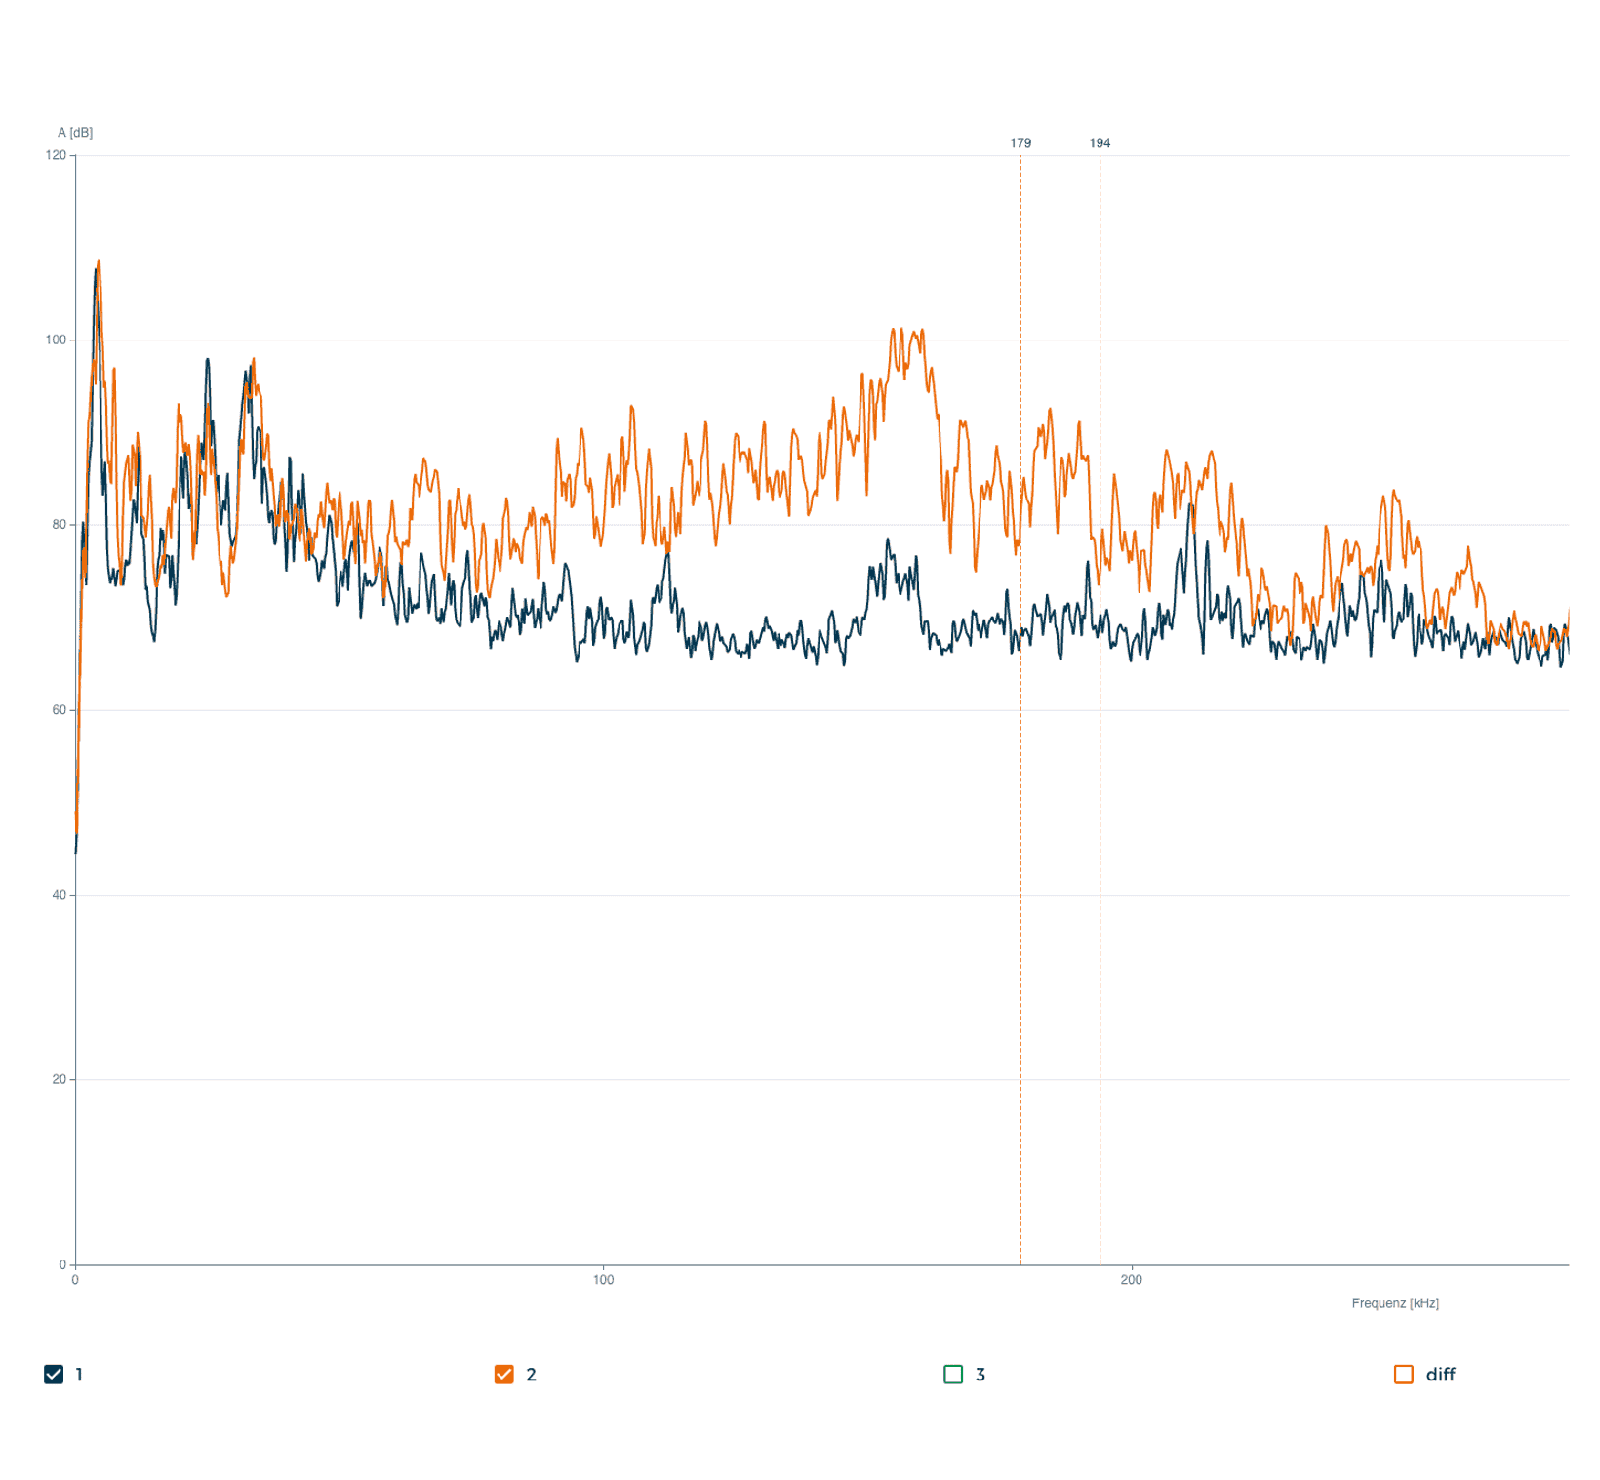
FFT Analysis
You can have a look at the FFT of each measurement point and analyze your signals in detail

Integration
Report results directly into your asset management system and trigger processes.